


CONSUMER CONFIDENCE BOLSTERS HOUSING MARKET BUT RECOVERY UNEVEN ACROSS CANADA
TORONTO, April 8, 2010 – After a buoyant, if geographically uneven start to the year, Canada’s housing market is poised to moderate as 2010 unfolds, according to the Royal LePage House Price Survey. The post-recession real estate recovery, which began in earnest in the third quarter of 2009, continued unabated in the first quarter of the year. While year-over-year unit sales volumes increased and prices appreciated across the country, a look back at the two year period that spanned the recession’s beginning and end shows that some cities have experienced a rollercoaster effect of declining and rising prices, while at the other extreme, home prices in some regions never stopped appreciating.
“The first quarter of 2010 continued where 2009 left off, with more Canadians enthusiastically participating in a rejuvenated residential real estate market,” said Phil Soper, president and chief executive, Royal LePage Real Estate Services. “One of the earliest sectors of the economy to return to growth after the difficult recessionary period, the housing sector has been a prime beneficiary of low borrowing costs and improving consumer confidence.”
House prices were up across all key housing types surveyed by Royal LePage, with the average price of a detached bungalow in Canada rising almost 11 per cent to $329,209 in the first quarter year-over-year, while standard two-storey homes rose 10.3 per cent to $365,141 and standard condominiums increased 10.9 per cent to $228,963.
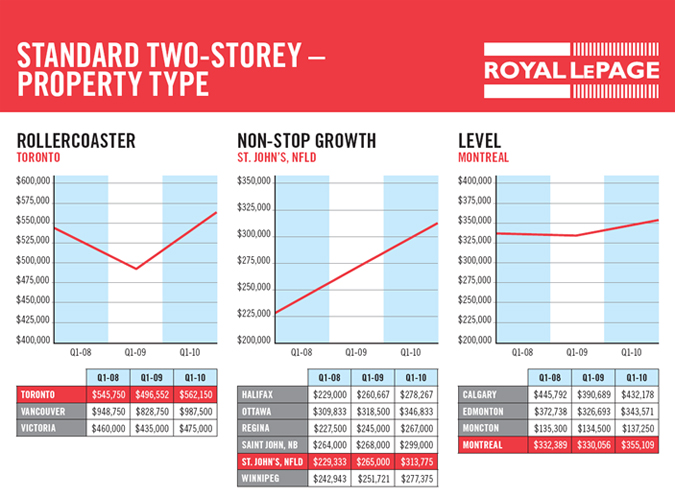
While some analysts have described house price increases over the past 12 months as a national housing boom, an analysis of Royal LePage data from Q1 2008 through Q1 2010 shows three different patterns of house price trends in Canada’s major cities:
a rollercoaster effect in which prices dropped sharply then rose dramatically to levels that exceed pre-recessionary prices (Toronto, Vancouver and Victoria);
non-stop growth markets, which were generally resilient through the downturn with incremental price appreciation over a two-year period (Halifax, Ottawa, Regina, Saint John, St.John’s and Winnipeg); and
level markets, where house prices have remained relatively unchanged (Calgary, Edmonton, Moncton and Montreal).
“National averages from our first quarter report are not particularly useful in painting a picture of the country’s neighbourhood real estate stories. House sale data from the past two year period shows tremendous variances in terms of how different cities reacted to the recession,” Soper said. “In Vancouver and Toronto, for instance, the dramatic unit sales fluctuations exhibit a significant degree of market irrationality: inordinately fearful when faced with poorer markets; and overly enthusiastic when the tables turned. Montreal is an example of a city where the market has been much more stable and homeowners there seem quite happy with the relatively slow pace of change.”
“Even in our most frenzied pockets of market activity, the inevitable rise in interest rates coupled with home price appreciation will rein in demand as affordability erodes. Expect house prices to continue to rise, but the rate of appreciation should ebb steadily, month by month, throughout the remainder of the year, as balance returns to the industry,” concluded Soper.
Source: Royal LePage Real Estate Services
Royal LePage compared first-quarter house prices from 2008, 2009 and 2010 to show the variances in market trends across Canada. While cities such as Toronto and Vancouver rebounded dramatically from the price declines brought on by the recession in late 2008 and early 2009 – producing a rollercoaster effect – other markets such as Montreal have shown greater stability and steady year-over-year growth.
In addition to strong price appreciation in the first quarter of 2010, the volume of sales also increased year-over-year as pent-up demand from constrained supply of homes for sale in 2009, coupled with unseasonably warm weather, prompted a spike in home sales in the country’s largest housing markets from January through March.
Regional House Price Data
Royal LePage’s latest quarterly House Price Survey shows the strongest growth in year-over-year increases in Vancouver, where detached bungalows were up 21.8 per cent over 2009, to $906,045, standard two-storey houses rose 19.2 per cent to $987,500 and standard condominiums increased 15.7 per cent to $470,500. Because of strong demand, first quarter unit sales in Vancouver were nearly double those of last year. Victoria home prices also showed strong growth year-over-year, with detached bungalows up 12.9 per cent to $511,400.
In Ontario, home prices rose across all key housing types in all of the markets surveyed by Royal LePage, with detached bungalows and standard two-storey homes in Toronto seeing some of the largest gains. Greater Toronto home prices rose an average of 10 to 13.3 per cent year-over-year, with detached bungalows reaching an average price of $459,107 in the first quarter. Ottawa price appreciation ranged from 8 to 11.1 per cent year-over-year, with standard two-storey homes averaging $346,833 in the first quarter.
In Montreal, where average prices increased between 7.2 and 7.6 per cent year-over-year, a standard two-storey home was $355,109 in the first quarter of 2010. The real estate market has been extremely active on the Island of Montreal. Low inventory, combined with the presence of first time buyers and consumers’ desire to beat the expected interest rates hikes have contributed to an increase in average house prices for the first quarter of 2010.
In the Atlantic Provinces, house price appreciation was generally modest, with the exception of St. John’s, Newfoundland, which saw significant increases year-over-year as prices for the three key housing types rose between 17.6 to 18.4 per cent. The average price of a standard two-storey home in St. John’s increased to $313,775 in Q1 2010. Saint John, New Brunswick, also showed strong growth in detached homes, with bungalows up 16 per cent year-over-year to $233,775. Halifax also showed year-over-year price appreciation across all housing types, with standard two-storey houses up 6.8 per cent to $278,267.
Strong economic performance in Saskatchewan continued to bolster the housing market in Regina, where the average standard two-storey house increased 9 per cent to $267,000 in Q1 2010. The city’s limited supply of homes for sale – inventory is at 60 to 70 per cent of 2009 levels – is prompting multiple offers. Meanwhile, similar market dynamics in Saskatoon are putting upward pressure on prices, with standard condominiums seeing year-over-year price gains of 28.3 per cent, to $240,000. Prices for detached bungalows increased by 4.3 per cent in Regina and standard two-storey houses increased 9 per cent.
Average prices in Winnipeg jumped between 9.6 and 11.9 per cent year-over-year, with detached bungalows reaching $259,313 in the first quarter. Price appreciation is being driven by limited inventory and active first time buyers taking advantage of low interest rates.
Housing markets in Alberta continued to recover in the first quarter of this year. Although still averaging lower than pre-recession prices, all housing types in Calgary saw year-over-year price increases ranging from 7 per cent to 10.6 per cent. In Edmonton, home prices remained flat or increased year-over-year, with standard two-storey homes experiencing the largest increases at 5.2 per cent.
About the Royal LePage House Price Survey
The Royal LePage House Price Survey is the largest, most comprehensive study of its kind in Canada, with information on seven types of housing in over 250 neighbourhoods from coast to coast. This release references an abbreviated version of the survey, which highlights house price trends for the three most common types of housing in Canada in 80 communities across the country. A complete database of past and present surveys is available on the Royal LePage Web site at www.royallepage.ca. Current figures will be updated following the complete tabulation of the data for the first quarter. A printable version of the first quarter 2010 survey will be available online on May 7th, 2010. Housing values in the Royal LePage House Price Survey are Royal LePage opinions of fair market value in each location, based on local data and market knowledge provided by Royal LePage residential real estate experts. Historical data is available for some areas back to the early 1970s.
Royal LePage Q1 2010 House Price Survey (.PDF)
Add a Comment
Interconnected Real Estate Software for Brokers and Agents